




Contributors
Subscribe to our newsletter
As nicotine, caffeine, oral health, and other pouches continue to grow in popularity, manufacturers face increasing pressure to understand exactly what is inside their products, down to the particulate level. For companies seeking FDA marketing authorization through the Premarket Tobacco Product Application (PTMA) pathway, characterizing the pouch powder particles is now a key part of the submission process.
RJ Lee Group recently helped a nicotine pouch manufacturer by using particle sizing, scanning electron microscopy (SEM), and careful sample conditioning to analyze the powder inside the pouches. Here is how we approached the analysis and why each step of the process matters.
Why Particle Characterization Matters for Nicotine Pouches
When the FDA reviews a new nicotine product, it is not just looking at the ingredient list. Reviewers want to understand how a product is manufactured, how consistent it is from batch to batch, and how its physical properties might influence the way it performs once it reaches a consumer. For a powder-filled pouch, particle size and shape can affect how quickly the contents dissolve, how evenly nicotine is released, and how consistent one pouch is compared to the next. That makes particle characterization data a meaningful part of the scientific record a manufacturer builds to support an application.
For this project, the manufacturer submitted multiple samples of finished pouches for testing, with the goal of building a detailed, defensible picture of the powder's particle size and morphology. Testing of this powder was not a simple task, however. The pouch manufacturer faced challenges in testing their product because the unique properties of the material did not allow for the use of a single instrument or test method. They turned to RJ Lee Group to develop a custom test method.
The pouch manufacturer faced challenges in testing their product because the unique properties of the material did not allow for the use of a single instrument or test method.
The team at RJ Lee Group approached the work in three distinct stages: first examining how the samples arrived and were prepared for testing, then conditioning and dispersing the powder in a way that would not distort the results, and finally analyzing the material using laser diffraction and electron microscopy. The sections below walk through each of those stages.
Sample Description
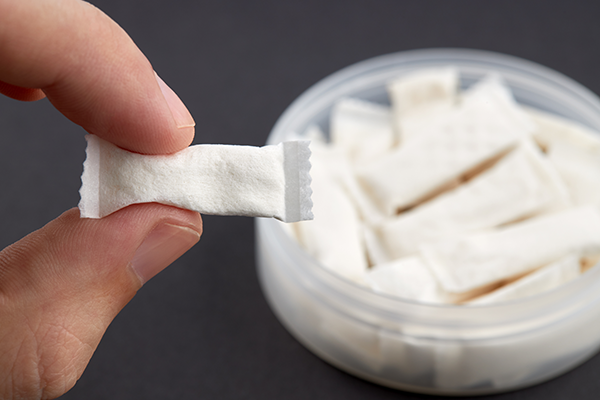
Each sample submitted for testing consisted of three unopened cans, with twenty white pouches per can, all from the same production batch. To capture a representative volume for analysis, pouches were randomly selected across all three cans rather than relying on a single can.
Preparing the Powder for Analysis
Before any measurement could take place, the cans were photographed as received and then opened using a stainless-steel scalpel blade. The contents of multiple pouches were emptied into an aluminum boat for handling.
From there, the powder went through a multi-step conditioning process designed to obtain an accurate read on the material's true particle size, rather than measurements skewed by moisture or clumping. The sample sat in an environmental chamber for at least twelve hours, held at 50 degrees Celsius and 50 percent relative humidity, before being gently agitated in a shaker with no milling media for one minute. This loosened any weak agglomerates without breaking apart the individual particles themselves.
The conditioned powder was then passed through a 600-micron sieve, separating it into a coarser fraction and a finer fraction. Each fraction was set aside for imaging, while the finer fraction also went on to particle size testing.
Why This Particular Prep Process
Every step in this prep process was chosen to answer one question: are we measuring the real particles or an artifact of how the powder was handled?
Wet dispersion methods are common in particle size testing, but they were ruled out here because some of the powder's ingredients are partially soluble in water. Dispersing the sample in a liquid carrier risked dissolving part of the material, which would have changed the apparent particle size and produced misleading results. A dry method kept the powder's native structure intact throughout testing.
Moisture was the other major variable to control. Powders that pick up ambient humidity tend to clump together, with fine particles bridging to one another through surface moisture. If left unaddressed, this clumping can make a powder look coarser than it actually is. Conditioning the sample at controlled temperature and humidity for an extended period dried it out just enough to break that moisture-driven bonding, leaving a free-flowing powder that better reflects the true size of the individual particles.
The brief shaking step served a similar purpose on a smaller scale. Without any milling media, the energy involved was enough to knock apart loosely bound clusters left over from conditioning or storage, but not enough to fracture the particles themselves. In other words, this step revealed the particles that were already there rather than creating new ones.
Finally, sieving at 600 microns was used to separate the bulk of the fine powder from any larger material before particle size testing. SEM imaging of both fractions afterward confirmed that the material caught above the sieve was not a genuinely coarse particle population. Instead, it was made up of the same small particles seen in the fine fraction, simply clustered together. That finding mattered because it showed the sieving step was sorting out reversible clumps, not real large particles, so the final particle size results were not skewed by material that did not belong in either category.
Running the Analysis
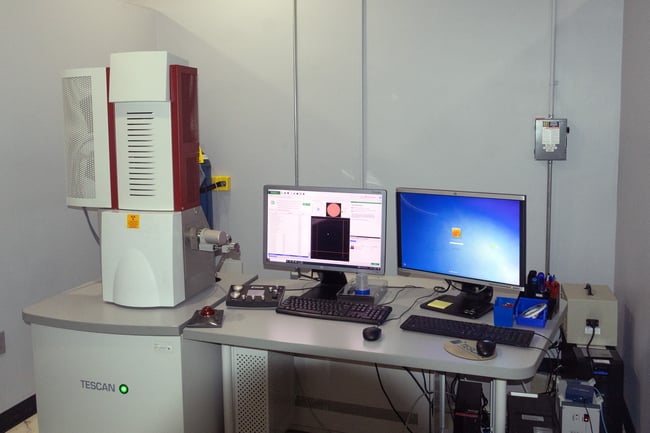
Two main instruments were crucial to this study. RJ Lee Group’s Malvern Mastersizer 3000 laser diffraction particle size analyzer measured the particle size distribution of the fine fraction, while a Tescan Mira 3XMH field emission SEM imaged both the fine and coarse fractions in backscatter electron mode at 20 kV. Together, these two techniques let the team confirm that what looked like larger particles under the sieve was not actually oversized material but loose clusters of much smaller particles.
Why This Matters for Manufacturers
For manufacturers, results like these do more than satisfy curiosity about a product's physical properties. They provide a clear, defensible basis for product specifications, since the data shows not just a single number but a well-understood distribution backed by imaging evidence. That level of detail is exactly what regulators look for when evaluating a manufacturing process: documentation that does not just report a result but explains why that result is reliable and reproducible. For a company building out a PTMA submission, having that kind of evidence on hand can determine whether an application raises follow-up questions or holds up to close review.
Get in Touch
Whether you are preparing a PTMA submission, validating a new formulation, or simply want a clearer picture of your product's physical properties, the particle characterization experts at RJ Lee Group can help. Contact us today to learn more about how our laser diffraction, SEM, and consulting services can support your next regulatory challenge.